One great thing about Node.js is how well it performs inside a container. The shift to containerized deployments and environments comes with extra complexity. This article addresses the added complexity of observability—seeing what's going on within your application and its resources. We will also cover how to set up OpenTelemetry to achieve this visibility. This is useful when resource usage wanders outside of the expected norms.
The Cloud Native Computing Foundation (CNCF) maintains a set of open source libraries and tools for visibility. OpenTelemetry is gaining momentum with developers to increase the observability of their Node.js applications through cross-component traces. OpenTelemetry with Jaeger as a backend is a great option for tracing Node.js applications running inside of a container. Although OpenTelemetry is still in an incubated status at the CNCF, it is the leading choice for tracing. You can read more about why we believe in the importance of distributed tracing on the distributed tracing Node.js Reference Architecture page.
This article demonstrates a scenario that illustrates how the lack of integration tests can lead to the appearance of an error in production. We investigate the error on a Red Hat OpenShift platform using OpenTelemetry traces to quickly answer the following questions:
- Where is the problem?
- What is causing the error?
Follow this 5-step demonstration to troubleshoot production errors:
Step 1. Set up prerequisites
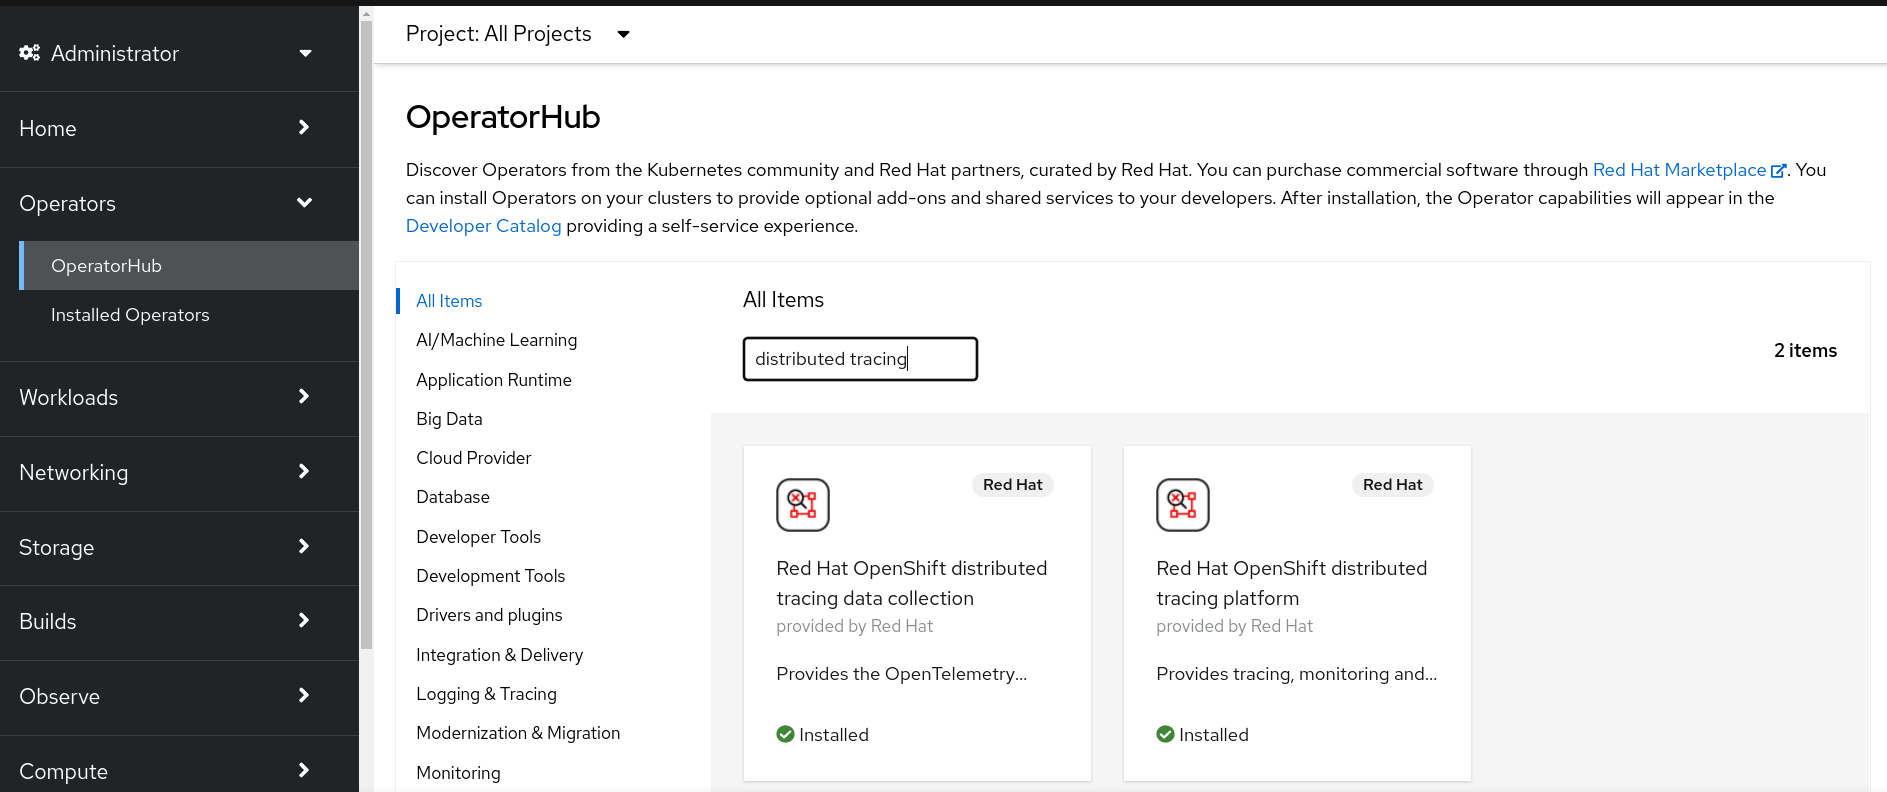
Following the steps in this article, requires an OpenShift cluster with the OpenShift distributed tracing platform Operator and OpenShift distributed tracing data collection Operator (Technology Preview) installed.
We are using OpenShift Local (formerly called Red Hat CodeReady Containers), which allows us to run a single-node OpenShift cluster locally. It doesn't have all the features of an OpenShift cluster. But OpenShift Local has everything we need for this article, and it's a good way to get started with OpenShift.
If you are going to use OpenShift Local, you can log in as kubeadmin and install the Operators via OperatorHub (Figure 1). If you work on an OpenShift cluster set up by an organization, ask the cluster administrator to install the Operators.
Step 2. Run the CRUD application example
For this demonstration, we will use the Nodeshift RESTful HTTP CRUD starter application. Clone this GitHub repository from the command line:
$ git clone https://github.com/nodeshift-blog-examples/nodejs-rest-http-crud.git
Navigate to the nodejs-rest-http-crud directory of the cloned repository:
$ cd nodejs-rest-http-crud
Make sure you are logged into your OpenShift cluster as a developer, using oc login. Create a new project called opentel:
$ oc new-project opentel
The nodejs-rest-http-crud example requires a PostgreSQL database. So install a Postgres db into your OpenShift cluster:
$ oc new-app -e POSTGRESQL_USER=luke -e POSTGRESQL_PASSWORD=secret -e POSTGRESQL_DATABASE=my_data centos/postgresql-10-centos7 --name=my-database
Step 3. Set up the Node.js program for tracing
We are going to add a bug deliberately to the Node.js program so you can simulate the process of tracing a problem. Open the lib/api/fruits.js file and change the SQL statement in the create function from INSERT INTO products to INSERT INTO product0. Changing the last character to zero makes the statement query a nonexistent database table.
Now deploy the example:
$ npm run openshift
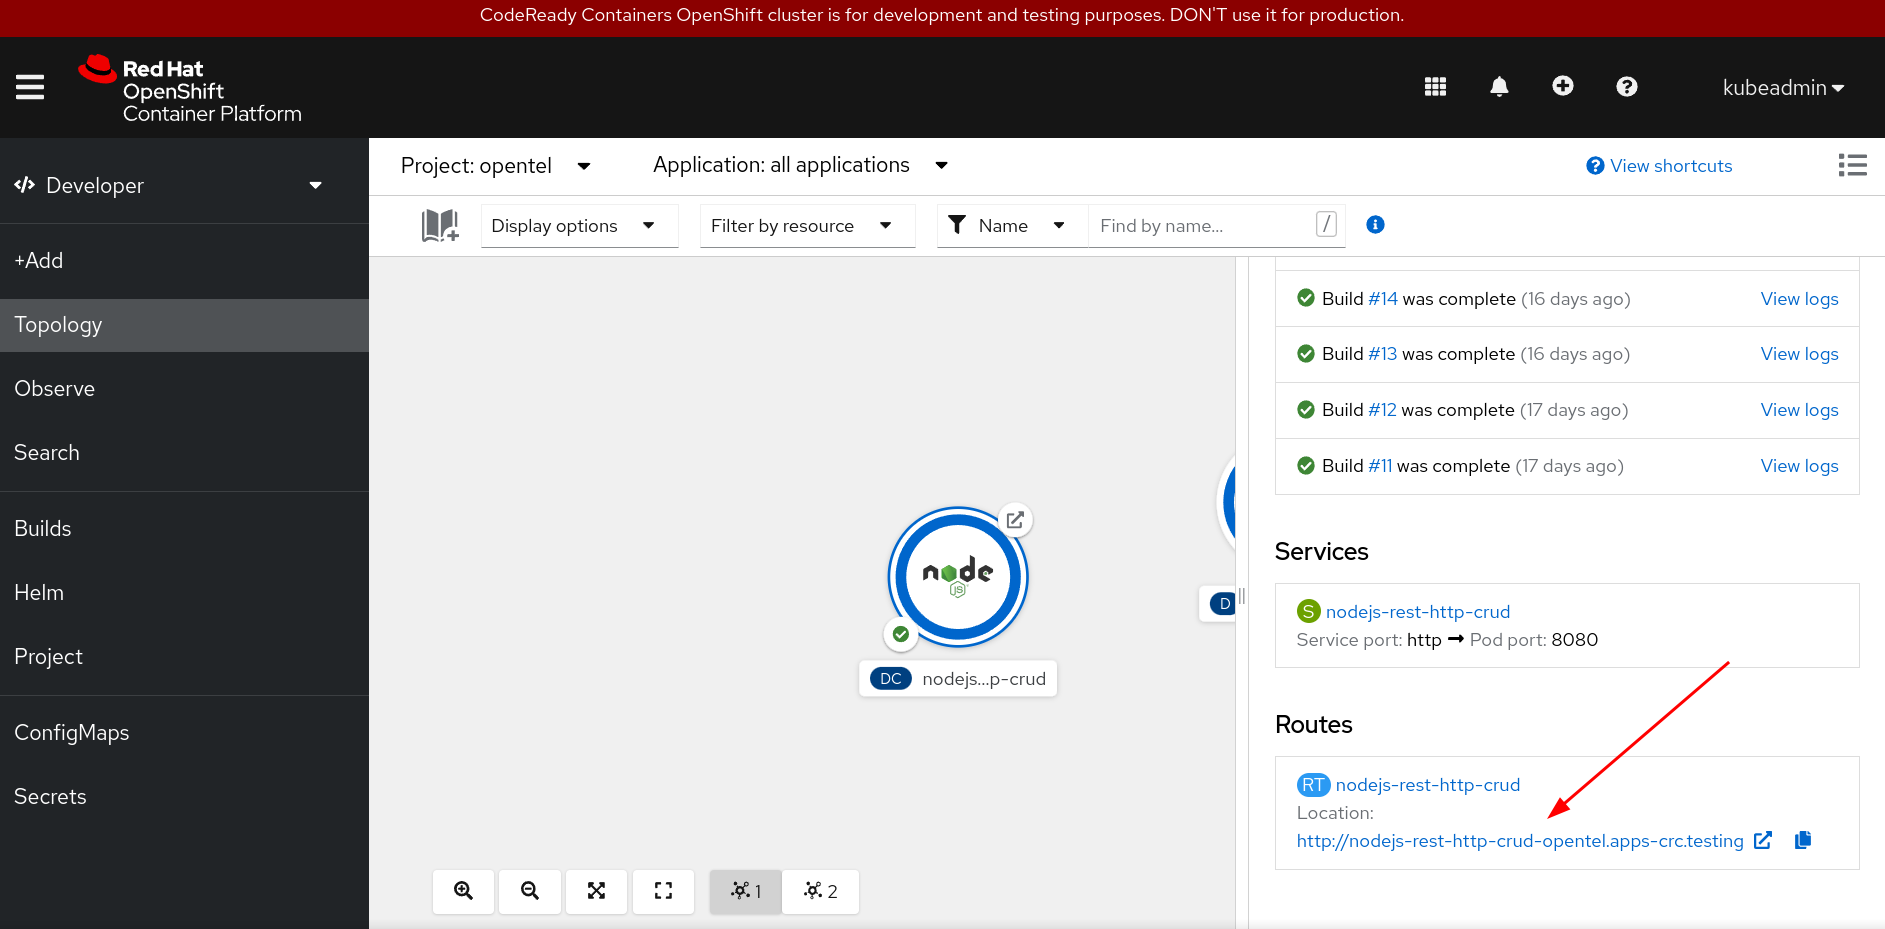
Once it's deployed, you should see the application and the database running in the developer topology view (Figure 2).

The application exposes an endpoint that you can find by selecting the application and scrolling down to the Routes section (Figure 3).
However, if you go to that page and try to add a fruit, the operation will fail and trigger a notification alert (see Figure 4). This error alert appears because the application has a typo inserted on the database table name. It should be products instead of product0.

Check the lib/api/fruits.js file within the project you cloned. If you are using an IDE, note that the spell check cannot highlight the error (Figure 5).

In other situations, the IDE will highlight a misspelled word (shown in Figure 6).

The typo we introduced would likely have been caught by integration tests. But the problem preventing the program from running is an example of something that can happen in production resulting from a lack of test coverage. In cases like these, tracing can not only identify the component where the error occurred but also identify the exact problem.
Step 4. Instrument the production application
Now you can instrument your application to quickly identify what is happening. Normally you would already have your production application instrumented, but we are demonstrating this example step by step.
To instrument the application:
- Add a number of OpenTelemetry dependencies to the
package.jsonfile. - Create a file named
tracer.jsthat will inject OpenTelemetry into the application.
We will detail these two tasks in the following subsections:
Add OpenTelemetry dependencies
The following list shows the dependencies we added. You may want to use newer versions, depending on when you are reading this article:
"@opentelemetry/api": "^1.1.0",
"@opentelemetry/exporter-jaeger": "^1.3.1",
"@opentelemetry/exporter-trace-otlp-http": "^0.29.2",
"@opentelemetry/instrumentation": "^0.29.2",
"@opentelemetry/instrumentation-express": "^0.30.0",
"@opentelemetry/instrumentation-http": "^0.29.2",
"@opentelemetry/instrumentation-pg": "^0.30.0",
"@opentelemetry/resources": "^1.3.1",
"@opentelemetry/sdk-node": "^0.29.2",
"@opentelemetry/sdk-trace-base": "^1.3.1",
"@opentelemetry/sdk-trace-node": "^1.3.1",
"@opentelemetry/semantic-conventions": "^1.3.1",
Create the tracer.js file
The content of the tracer.js file is:
'use strict';

const { diag, DiagConsoleLogger, DiagLogLevel } = require('@opentelemetry/api');

// SDK
const opentelemetry = require('@opentelemetry/sdk-node');

// Express, postgres and http instrumentation
const { NodeTracerProvider } = require('@opentelemetry/sdk-trace-node');
const { registerInstrumentations } = require('@opentelemetry/instrumentation');
const { HttpInstrumentation } = require('@opentelemetry/instrumentation-http');
const { ExpressInstrumentation } = require('@opentelemetry/instrumentation-express');
const { PgInstrumentation } = require('@opentelemetry/instrumentation-pg');

// Collector trace exporter
const { Resource } = require('@opentelemetry/resources');
const { SemanticResourceAttributes } = require('@opentelemetry/semantic-conventions');
const { SimpleSpanProcessor } = require('@opentelemetry/sdk-trace-base');
const { OTLPTraceExporter } = require('@opentelemetry/exporter-trace-otlp-http');

diag.setLogger(new DiagConsoleLogger(), DiagLogLevel.DEBUG);

// Tracer provider
const provider = new NodeTracerProvider({
  resource: new Resource({ [SemanticResourceAttributes.SERVICE_NAME]: 'fruits' })
});

registerInstrumentations({
  instrumentations: [
    // Currently to be able to have auto-instrumentation for express
    // We need the auto-instrumentation for HTTP.
    new HttpInstrumentation(),
    new ExpressInstrumentation(),
    new PgInstrumentation()
  ]
});

// Tracer exporter
const traceExporter = new OTLPTraceExporter({ url: 'http://opentel-collector-headless.opentel.svc:4318/v1/traces' });
provider.addSpanProcessor(new SimpleSpanProcessor(traceExporter));
provider.register();

// SDK configuration and start up
const sdk = new opentelemetry.NodeSDK({ traceExporter });

(async () => {
  try {
    await sdk.start();
    console.log('Tracing started.');
  } catch (error) {
    console.error(error);
  }
})();

// For local development to stop the tracing using Control+c
process.on('SIGINT', async () => {
  try {
    await sdk.shutdown();
    console.log('Tracing finished.');
  } catch (error) {
    console.error(error);
  } finally {
    process.exit(0);
  }
});
Don't worry, you don't need to change the core business code to make it work. You would just require tracer.js at the top of the app.js file. But we have already coded that line here. Now you only need to uncomment the require('./tracer'); line in our example.
This tracer.js file is composed of several parts that refer to the plugins we are using. You could adapt the file for your specific needs. The following documentation provides more information:
Step 5. Trace with OpenTelemetry
In this section, we will debug OpenTelemetry. This helps us troubleshoot our tracer.js code.
-
Set up the trace as follows:
const { diag, DiagConsoleLogger, DiagLogLevel } = require('@opentelemetry/api');

diag.setLogger(new DiagConsoleLogger(), DiagLogLevel.DEBUG);
Then create a new resource for NodeTracerProvider to help identify our service inside Jaeger. In this case, we use the service name, fruits:
const provider = new NodeTracerProvider({
  resource: new Resource({ [SemanticResourceAttributes.SERVICE_NAME]: 'fruits' })
});
Because this is an Express application that also uses PostgreSQL, we want to trace those layers. We also need to register HttpInstrumentation to make ExpressInstrumentation work.
-
Register the instrumentation:
registerInstrumentations({
  instrumentations: [
    new HttpInstrumentation(),
    new ExpressInstrumentation(),
    new PgInstrumentation()
  ]
});
-
Create the following trace exporter:
const traceExporter = new OTLPTraceExporter({ url: 'http://opentel-collector-headless.opentel.svc:4318/v1/traces' });
You can add an environment variable if you need to specify a different URL for the OpenTelemetry Collector.
-
Install Jaeger and OpenTelemetry Collector
To continue this configuration, we need to give user admin rights on the opentel project to the developer to successfully install both the Jaeger and OpenTelemetry Collector Operators.
$ oc policy add-role-to-user admin developer -n opentel
Create and apply a Jaeger custom resource:
$ oc apply -f tracing/jaeger.yml
Create an OpenTelemetryCollector custom resource:
$ oc apply -f tracing/opentel-collector.yml
Inside OpenShift, the topology menu now shows the components (Figure 7).

We have installed the Collector along with the auto-instrumentation plugins installed when we added tracer.js to app.js. Now, these plugins will catch and send the traces to the Collector instance in our namespace. The Collector will receive, process, and export them to the Jaeger instance in our namespace.
-
Check the traces:
Go back to the application and try to add a new fruit again. You will still get the same error, but traces of additional information now appear in the Jaeger UI.
To view these traces, click on the Jaeger link icon in the topology. The icon is a little box with an outgoing arrow (Figure 8). You might have to log in again the first time you check the traces.

The icon takes you to the Jaeger UI (Figure 9), where you can filter traces based on the service called fruits (set in our tracer.js configuration) and identify the error:
- Enter
fruitsin the Service box. - Enter
POST /api/fruitsin the Operation box. - Select the Find traces button.

Click on the error trace to view all the operations passing through Express and its middleware up to the database (Figure 10).

Click on the error to view more specific details (Figure 11).
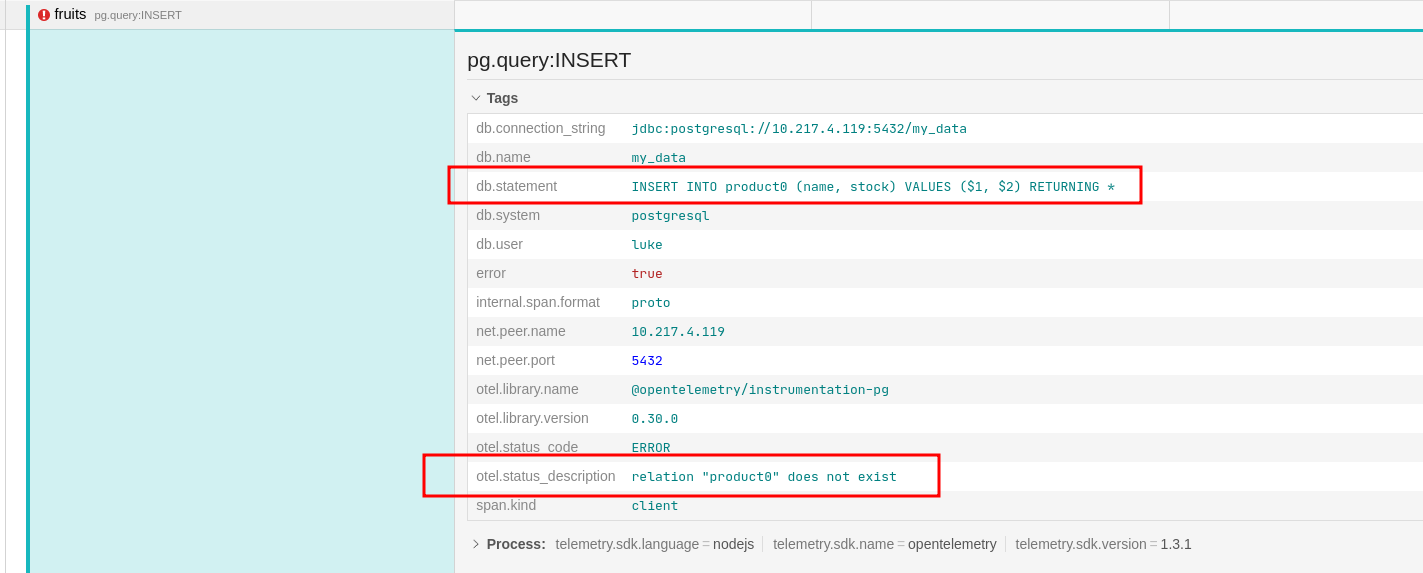
Jaeger provides the SQL statement. Here you can double-check the code and the error message on the otel.status_description line: "relation 'product0' does not exist."
This information reveals that, although the error was reported from the database component, the problem springs from the application, which specified a table that does not exist. This information allows you to go back to the application and fix the bug.
Although this example is a bit contrived, it illustrates the level of information provided by auto-instrumentation, as well as the power of connecting the information provided with the flow of the request through the application's components.
Another benefit of OpenTelemetry is that the same trace for the /api/fruits request shows the time spent in the pg:query:select step. If this step creates a performance problem, you might be able to resolve it by adding an additional index to the products table.
OpenTelemetry benefits networked applications
This article illustrated how OpenTelemetry tracing increases observability for a Node.js deployment in OpenShift. The tracer.js example demonstrated:
- That operators provided by Red Hat were easily installed in OpenShift, creating individual OpenTelemetry Collector and Jaeger instances for an application.
- The addition of auto-instrumentation plugins for common Node.js packages to an existing Node.js application.
- The captured traces answered two key questions: Where is the problem and what is causing the error? In our example, the answers were: The problem was located in the database layer source code and a typo in an SQL statement caused that bug.
Has this piqued your interest in trying OpenTelemetry in your environment? We hope this article has helped you understand how you to use OpenTelemetry with a Node.js application deployed to OpenShift.
Read more about observability, Red Hat distributed tracing, and OpenTelemetry. To learn more about what Red Hat is up to on the Node.js front, check out our Node.js topic page.
Last updated: November 8, 2023