Redhat Developers  Logo
  • Products

    Featured

    • Red Hat Enterprise Linux
      Red Hat Enterprise Linux Icon
    • Red Hat OpenShift AI
      Red Hat OpenShift AI
    • Red Hat Enterprise Linux AI
      Linux icon inside of a brain
    • Image mode for Red Hat Enterprise Linux
      RHEL image mode
    • Red Hat OpenShift
      Openshift icon
    • Red Hat Ansible Automation Platform
      Ansible icon
    • Red Hat Developer Hub
      Developer Hub
    • View All Red Hat Products
    • Linux

      • Red Hat Enterprise Linux
      • Image mode for Red Hat Enterprise Linux
      • Red Hat Universal Base Images (UBI)
    • Java runtimes & frameworks

      • JBoss Enterprise Application Platform
      • Red Hat build of OpenJDK
    • Kubernetes

      • Red Hat OpenShift
      • Microsoft Azure Red Hat OpenShift
      • Red Hat OpenShift Virtualization
      • Red Hat OpenShift Lightspeed
    • Integration & App Connectivity

      • Red Hat Build of Apache Camel
      • Red Hat Service Interconnect
      • Red Hat Connectivity Link
    • AI/ML

      • Red Hat OpenShift AI
      • Red Hat Enterprise Linux AI
    • Automation

      • Red Hat Ansible Automation Platform
      • Red Hat Ansible Lightspeed
    • Developer tools

      • Red Hat Trusted Software Supply Chain
      • Podman Desktop
      • Red Hat OpenShift Dev Spaces
    • Developer Sandbox

      Developer Sandbox
      Try Red Hat products and technologies without setup or configuration fees for 30 days with this shared Openshift and Kubernetes cluster.
    • Try at no cost
  • Technologies

    Featured

    • AI/ML
      AI/ML Icon
    • Linux
      Linux Icon
    • Kubernetes
      Cloud icon
    • Automation
      Automation Icon showing arrows moving in a circle around a gear
    • View All Technologies
    • Programming Languages & Frameworks

      • Java
      • Python
      • JavaScript
    • System Design & Architecture

      • Red Hat architecture and design patterns
      • Microservices
      • Event-Driven Architecture
      • Databases
    • Developer Productivity

      • Developer productivity
      • Developer Tools
      • GitOps
    • Secure Development & Architectures

      • Security
      • Secure coding
    • Platform Engineering

      • DevOps
      • DevSecOps
      • Ansible automation for applications and services
    • Automated Data Processing

      • AI/ML
      • Data Science
      • Apache Kafka on Kubernetes
      • View All Technologies
    • Start exploring in the Developer Sandbox for free

      sandbox graphic
      Try Red Hat's products and technologies without setup or configuration.
    • Try at no cost
  • Learn

    Featured

    • Kubernetes & Cloud Native
      Openshift icon
    • Linux
      Rhel icon
    • Automation
      Ansible cloud icon
    • Java
      Java icon
    • AI/ML
      AI/ML Icon
    • View All Learning Resources

    E-Books

    • GitOps Cookbook
    • Podman in Action
    • Kubernetes Operators
    • The Path to GitOps
    • View All E-books

    Cheat Sheets

    • Linux Commands
    • Bash Commands
    • Git
    • systemd Commands
    • View All Cheat Sheets

    Documentation

    • API Catalog
    • Product Documentation
    • Legacy Documentation
    • Red Hat Learning

      Learning image
      Boost your technical skills to expert-level with the help of interactive lessons offered by various Red Hat Learning programs.
    • Explore Red Hat Learning
  • Developer Sandbox

    Developer Sandbox

    • Access Red Hat’s products and technologies without setup or configuration, and start developing quicker than ever before with our new, no-cost sandbox environments.
    • Explore Developer Sandbox

    Featured Developer Sandbox activities

    • Get started with your Developer Sandbox
    • OpenShift virtualization and application modernization using the Developer Sandbox
    • Explore all Developer Sandbox activities

    Ready to start developing apps?

    • Try at no cost
  • Blog
  • Events
  • Videos

How to enable OpenTelemetry traces in React applications

March 22, 2023
Purva Naik
Related products:
Red Hat OpenShift

Share:

    The main focus of this article is to demonstrate how to instrument React applications to make them observable. For a good overview of observability and OpenTelemetry, please take a look at the article, Observability in 2022: Why it matters and how OpenTelemetry can help.

    10-step OpenTelemetry demonstration

    Related to the OpenTelemetry, we are using the following:

    • Auto instrumentation via sdk-trace-web and a plugin to provide auto instrumentation for fetch.
    • OpenTelemetry Collector (also known as OTELCOL).
    • Jaeger
    • Basic collector deployment pattern. For more information about OTELCOL deployment patterns, please take a look at OpenTelemetry Collector Deployment Patterns.

    Step 1. Set up prerequisites

    In this demo, we are going to use Docker and docker-compose. You can refer to Docker and docker-compose to learn more.

    Step 2. Run the React application example

    You will be using a front-end react application that contains the sample React application code that we will instrument. Please note that the repository also contains an Express application as a back end, but the focus of this tutorial is to instrument the front end only.

    The front-end application contains a button that calls the back end using Express and a scroll component that calls the https://randomuser.me/ free public API. We are going to delegate to OpenTelemetry libraries the job of capturing traces for the button and the scroll component. So every time the user clicks on the button or scrolls the page, the auto-instrumentation plugin will generate traces for this.

    Clone the following GitHub repository from the command line:

    git clone https://github.com/obs-nebula/frontend-react.git

    Step 3. Instrument the React application

    The following list shows the dependencies we added. You may want to use newer versions, depending on when you are reading this article:

    "@opentelemetry/exporter-trace-otlp-http": "^0.35.0",
    
    "@opentelemetry/instrumentation": "^0.35.0",
    
    "@opentelemetry/instrumentation-fetch": "^0.35.0",
    
    "@opentelemetry/resources": "^1.9.1",
    
    "@opentelemetry/sdk-trace-web": "^1.8.0",
    
    "@opentelemetry/semantic-conventions": "^1.9.1"

    Create a file named tracing.js that will load OpenTelemetry. We are going to share more details in the following subsections. The content of the front-end/src/tracing.js file is as follows:

    const { Resource } = require('@opentelemetry/resources');
    
    const { SemanticResourceAttributes } = require('@opentelemetry/semantic-conventions');
    
    const { WebTracerProvider, SimpleSpanProcessor, ConsoleSpanExporter } = require('@opentelemetry/sdk-trace-web');
    
    const { OTLPTraceExporter }  = require('@opentelemetry/exporter-trace-otlp-http');
    
    const { registerInstrumentations } = require('@opentelemetry/instrumentation');
    
    const { FetchInstrumentation } = require('@opentelemetry/instrumentation-fetch');
    
    const consoleExporter = new ConsoleSpanExporter();
    
    const collectorExporter = new OTLPTraceExporter({
    
      headers: {}
    
    });
    
    const provider = new WebTracerProvider({
    
      resource: new Resource({
    
        [SemanticResourceAttributes.SERVICE_NAME]: process.env.REACT_APP_NAME
    
      })
    
    });
    
    const fetchInstrumentation = new FetchInstrumentation({});
    
    fetchInstrumentation.setTracerProvider(provider);
    
    provider.addSpanProcessor(new SimpleSpanProcessor(consoleExporter));
    
    provider.addSpanProcessor(new SimpleSpanProcessor(collectorExporter));
    
    provider.register();
    
    registerInstrumentations({
    
      instrumentations: [
    
        fetchInstrumentation
    
      ],
    
      tracerProvider: provider
    
    });
    
    export default function TraceProvider ({ children }) {
    
      return (
    
       <>
    
          {children}
    
       </>
    
      );
    
    }

    Step 4. Import the required modules

    Next, you will need to import the OpenTelemetry modules. As you can see, we can get the ConsoleSpanExporter and SimpleSpanProcessor from the @opentelemetry/sdk-trace-web so we don’t need to add an extra dependency for this.

    const { Resource } = require('@opentelemetry/resources');
    
    const { SemanticResourceAttributes } = require('@opentelemetry/semantic-conventions');
    
    const { WebTracerProvider,SimpleSpanProcessor, ConsoleSpanExporter } = require('@opentelemetry/sdk-trace-web');
    
    const { OTLPTraceExporter }  = require('@opentelemetry/exporter-trace-otlp-http');
    
    const { registerInstrumentations } = require('@opentelemetry/instrumentation');
    
    const { FetchInstrumentation } = require('@opentelemetry/instrumentation-fetch');

    Step 5. Initialize the tracer

    Since we are using React with JavaScript, to initialize the OpenTelemetry tracer, you will need to create a new instance of the TraceProvider and pass it as a property to your root React component. You can do this by adding the following code to your main application file, in our case, that is in index.js file.

    import TraceProvider from './tracing';
    
    const root = ReactDOM.createRoot(document.getElementById('root'));
    
    root.render(
    
      <TraceProvider>
    
        <App />
    
      </TraceProvider>
    
    );

    Step 6. Create an OTELCOL exporter instance

    To export the traces to OTELCOL, you will need to create an instance of OTLPTraceExporter.

    Note that we are adding a workaround to use XHR instead of sendBeacon, as described in this OpenTelemetry JS upstream issue. With that, we can fix the CORS problem when exporting.

    const collectorExporter = new OTLPTraceExporter({
    
    headers: {}
    
    });

    Step 7. Create the otel-collector-config file

    Now let’s take a look at the yaml file content. To configure the OTELCOL, you will need to create a new file called otel-collector-config.yaml in your root directory. In this file, we are going to configure the receiver, processor, and exporters (using Jaeger and logging as exporters).

    receivers:
    
      otlp:
    
        protocols:
    
          http:
    
            cors:
    
              allowed_origins: ["*"]
    
              allowed_headers: ["*"]
    
    exporters:
    
      logging:
    
        verbosity: Detailed
    
      jaeger:
    
        endpoint: jaeger-all-in-one:14250
    
        tls:
    
          insecure: true
    
    processors:
    
      batch:
    
    service:
    
      telemetry:
    
        logs:
    
          level: "debug"
    
      pipelines:
    
        traces:
    
          receivers: [otlp]
    
          exporters: [logging, jaeger]
    
          processors: [batch]

    Step 8. Create a docker compose file

    Create a docker-compose file and define the services for OTELCOL, Jaeger, and the application as follows:

    version: "2"
    
    services:
    
      front-end:
    
        build:
    
          context:./front-end
    
        depends_on:
    
          - express-server
    
        ports:
    
          - "3000:3000"
    
        env_file:
    
         -./front-end/src/.env
    
      express-server:
    
        build:
    
          context:./express-server
    
        ports:
    
          - "5000:5000"
    
      collector:
    
        image: otel/opentelemetry-collector:latest
    
        command: ["--config=/otel-collector-config.yaml"]
    
        volumes:
    
          - './otel-collector-config.yaml:/otel-collector-config.yaml'
    
        ports:
    
          - "4318:4318"
    
        depends_on:
    
          - jaeger-all-in-one
    
       # Jaeger
    
      jaeger-all-in-one:
    
        hostname: jaeger-all-in-one
    
        image: jaegertracing/all-in-one:latest
    
        ports:
    
          - "16685"
    
          - "16686:16686"
    
          - "14268:14268"
    
          - "14250:14250"

    Step 9. Start the services

    Once you have created OTELCOL config and Docker compose files, you can start the services by running the following command in your terminal:

    $docker-compose up

    Once the services are started you can access the react application at http://localhost:3000.

    As mentioned previously, every time the users scroll the page, it will generate random data through an API call and the OpenTelemetry will generate traces based on the scrolling activity.

    Step 10. View the traces in Jaeger

    You can view the traces in the Jaeger UI by navigating to http://localhost:16686. The horizontal circles in the chart represent button clicks, and the vertical circles represent scrolling activity, as shown in Figure 1.
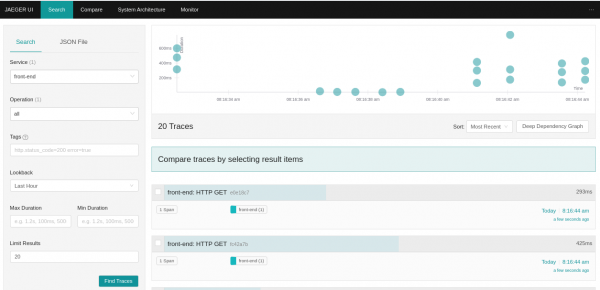
    The jaeger UI showing circles in the chart that represent button clicks and scrolling activity.
    Figure 1: Application tracing in Jaeger.

    Let's click on one of the horizontal items and expand the trace detail as shown in Figure 2:

    In the Jaeger UI, expanded trace detail shows the Express back-end was called and the OpenTelemetry library name.
    Figure 2: The expanded trace detail shows the Express back-end was called and the OpenTelemetry library name.

    We can see in Figure 2 that the Express back end was called, and the OpenTelemetry library name that is responsible for this trace generation.

    Now let’s click in one vertical circle as shown in Figure 3:
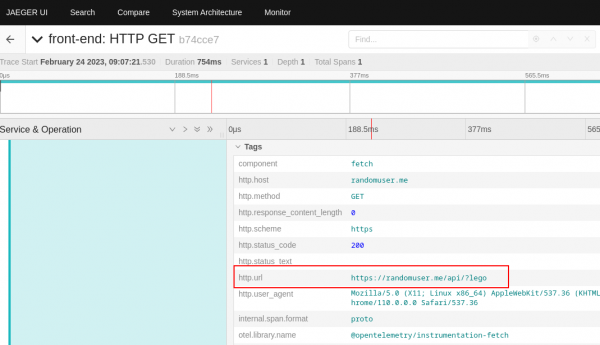
    The trace information showing that the scrolling activity is calling an external API.
    Figure 3: The trace information showing that the scrolling activity is calling an external API.

    We can see in Figure 3 that scrolling activity is calling an external API.

    Collecting and analyzing telemetry data

    You have successfully enabled OpenTelemetry in your React application using the OpenTelemetry collector and Jaeger. You can now start collecting and analyzing telemetry data. You can use the Jaeger UI to view traces, identify performance bottlenecks, and gain deeper understanding about what the React application is doing when calling external systems.

    Further reading

    Want to learn more about observability and OpenTelemetry? Check out these articles:

    • Observability in 2022: Why it matters and how OpenTelemetry can help
    • Distributed tracing with OpenTelemetry, Knative, and Quarkus
    • A guide to the open source distributed tracing landscape
    OSZAR »
    Last updated: August 14, 2023

    Related Posts

    • Observability in 2022: Why it matters and how OpenTelemetry can help

    • Build a monitoring infrastructure for your Jaeger installation

    • How to use OpenTelemetry to trace Node.js applications

    • Process Formula 1 telemetry with Quarkus and OpenShift Streams for Apache Kafka

    • OpenTelemetry: A Quarkus Superheroes demo of observability

    • Game telemetry with Kafka Streams and Quarkus, Part 1

    Recent Posts

    • What's new in network observability 1.8

    • LLM Compressor: Optimize LLMs for low-latency deployments

    • How to set up NVIDIA NIM on Red Hat OpenShift AI

    • Leveraging Ansible Event-Driven Automation for Automatic CPU Scaling in OpenShift Virtualization

    • Python packaging for RHEL 9 & 10 using pyproject RPM macros

    What’s up next?

    Gitops Cookbook e-book tile card

    GitOps has become a standard in deploying applications to Kubernetes, and many companies are adopting the methodology for their DevOps and cloud-native strategy. Get useful recipes and examples for successful hands-on applications development and deployment with GitOps in this free O'Reilly e-book.

    OSZAR »
    Download the GitOps Cookbook
    Red Hat Developers logo LinkedIn YouTube Twitter Facebook

    Products

    • Red Hat Enterprise Linux
    • Red Hat OpenShift
    • Red Hat Ansible Automation Platform

    Build

    • Developer Sandbox
    • Developer Tools
    • Interactive Tutorials
    • API Catalog

    Quicklinks

    • Learning Resources
    • E-books
    • Cheat Sheets
    • Blog
    • Events
    • Newsletter

    Communicate

    • About us
    • Contact sales
    • Find a partner
    • Report a website issue
    • Site Status Dashboard
    • Report a security problem

    RED HAT DEVELOPER

    Build here. Go anywhere.

    We serve the builders. The problem solvers who create careers with code.

    Join us if you’re a developer, software engineer, web designer, front-end designer, UX designer, computer scientist, architect, tester, product manager, project manager or team lead.

    Sign me up

    Red Hat legal and privacy links

    • About Red Hat
    • Jobs
    • Events
    • Locations
    • Contact Red Hat
    • Red Hat Blog
    • Inclusion at Red Hat
    • Cool Stuff Store
    • Red Hat Summit

    Red Hat legal and privacy links

    • Privacy statement
    • Terms of use
    • All policies and guidelines
    • Digital accessibility

    Report a website issue

    OSZAR »