Now Red Hat OpenShift Container Platform 4.17 has a new non-standard control plane high availability option that is enabled by new etcd capabilities and API server optimizations. The standard (prior to 4.17) control plane high availability requires two of three control plane nodes to maintain etcd quorum, which is still an option in 4.17. However, what’s new is the option to deploy four or five control plane nodes to enhance resiliency. This option is only for bare metal environments.
This article explains the new feature in OpenShift Container Platform 4.17 that allows a cluster to utilize four or five control nodes to enhance control plane resilience.
Enhanced control plane resilience in OpenShift Container Platform 4.17
Customers with hard requirements for active-active deployments across two locations requiring support for stateful traditional applications (e.g., Red Hat OpenShift Virtualization virtual machines (VMs) that can only run a single instance) have dependencies on the underlying infrastructure to provide the availability. These use cases are common when deploying VMs on traditional virtualization stacks. A traditional OpenShift cluster (<4.16) is deployed as a stretched or spanned cluster with a control-plane distribution of 2+1 or 1+1+1 to support those scenarios. During failure scenarios in the data center hosting the majority of control plane nodes, the surviving control plane node becomes the only node with the latest configuration and state of all the objects/resources on the cluster.
The recovery procedure in a disaster scenario for this configuration requires the single surviving node to become read-write and have the only copy of the etcd. Should that node fail, it will be a catastrophic failure. This is more critical when OpenShift Virtualization is also hosting stateful VMs. To increase resiliency and reduce risk for this scenario during this type of failure, RHOCP 4.17 extends the number of control plane nodes to support 2+2 and 3+2 deployments. In this scenario, a failure of a site with the majority of the nodes will still have two copies of etcd in read-only in the surviving location, providing higher assurance for the recoverability of the cluster. Recovering a control plane node is currently a manual process, but there are plans to automate this procedure in a future release.
You can do this by deploying a cluster with three control plane nodes and scale up on day two with the required configuration. There are future plans for the agent based installer to enable this configuration on day one.
FAQs
You may have questions about stretched clusters in RHOCP 4.17, such as:
Question: Were stretched clusters supported prior to RHOCP 4.17?
Answer: Yes but not recommended, and don't tell Redbeard as he illustrates the complications of a stretched three node cluster here. No support exception is required. For smaller discrete clusters, stretching the control plane is neither recommended nor supported.
Question: What about latency between the stretched control plane data centers? While there is a recommendation of less than 5ms between data center control plane nodes, there's no Red Hat OpenShift (or Kubernetes) limitation that dictates this latency number. Less than 5ms is a lofty goal, so what happens when/if the latency creeps up beyond that?
Answer: The most common issues with etcd are caused by slow storage, CPU overload, etcd database size growth, and latency between control nodes. Applying an etcd request should normally take fewer than 50 milliseconds. If the average apply duration exceeds 100 milliseconds, etcd will warn that entries are taking too long to apply (took-too-long messages appear in the logs). The 100ms number is the default profile parameter
ETCD_HEARTBEAT_INTERVAL, which can be modified to the slow profile that is 500ms (primarily for AWS & Azure deployments).Modifying the heartbeat profile only prevents things like leader (re)elections from happening—it does not help performance. This means that if API performance is a limiting factor in the cluster, such as a cluster with a busy GitOps deployment, then the latency profile will not help. A final caveat: third-party workloads and/or specialized layered products that may be installed on control plane nodes may impose latency limitations (i.e., Red Hat OpenShift Data Foundation (ODF) or other SDS CSI).
What do I need to monitor and how?
Again, the main causes of etcd issues are: slow storage/disk latency, CPU overload, etcd database size growth, and network latency between nodes. The following steps show how to monitor these issues.
From the console, navigate to Administrator -> Observe -> Dashboards.
Then select etcd from dashboard dropdown. This brings up a number of etcd specific graphs, as shown in Figures 1-3.

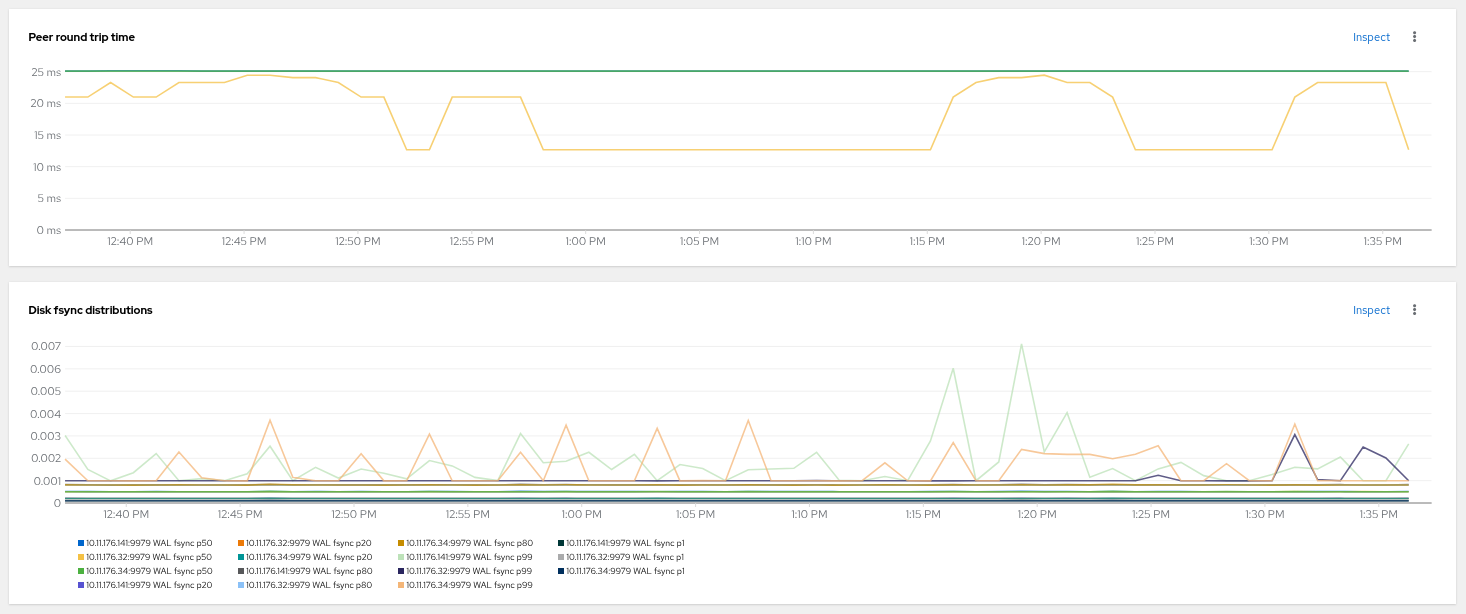

To rule out a slow disk, make sure it is less than 25ms by inspecting the Disk Sync Duration graph (Figure 4).

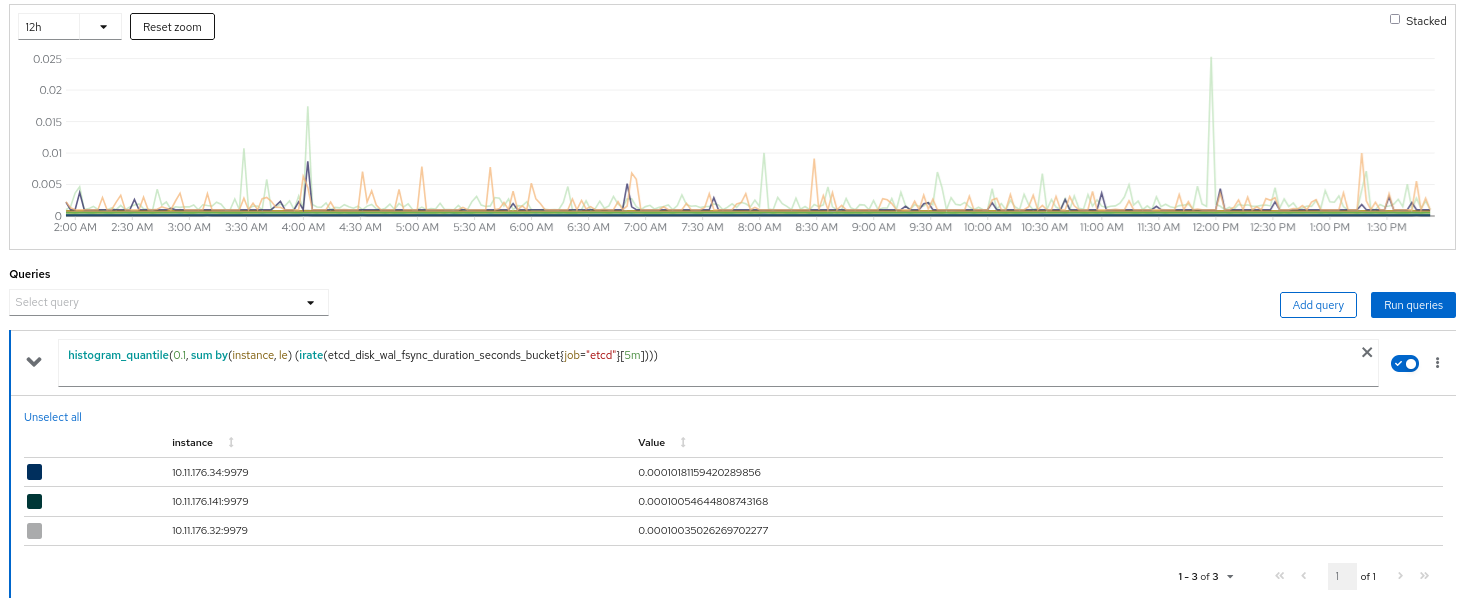
- You can also use Fio tool/suite, but it only provides a single point in time. Data fsync distributions should be less than 10ms, as shown in Figure 5.
Monitor CPU overload on the CPU IOwait graph. This is the amount of time a CPU spends waiting for input/output (I/O) operations to complete, such as disk or network access. High I/O wait times can indicate that the CPU is idle, but there are outstanding I/O requests, which can limit the CPU's performance. This value should be less than 4.0 (Figure 6).

View the etcd database size growth on the DB size graph by clicking the inspect link in Figure 7.

You can view network latency in the peer round trip time by hitting the inspect link in Figure 8. The latency between nodes should be less than 50ms.

Measuring jitter between nodes
A final factor that may come into play is network jitter between nodes. Jitter is latency variation typically caused by path congestion, resource contention, or hardware performance. Network latency plus jitter is the number that should be less than 50ms.
You can measure network jitter among all control plane nodes using the iPerf3 tool in UDP mode. The following KCS articles document a way to build and run custom iperf container images:
- KCS 5233541—Testing Network Bandwidth in Red Hat OpenShift using iPerf Container.
- KCS 6129701—How to run iPerf network performance test in Red Hat OpenShift Container Platform 4.
Follow these steps to measure jitter between two nodes, using the container image from KCS 6129701:
Connect to one of the control plane nodes and run the iPerf container as iPerf server in host network mode. When running in server mode, the tool accepts transmission control protocol (TCP) and user datagram protocol (UDP) tests:
podman run -ti --rm --net host quay.io/kinvolk/iperf3 iperf3 -sThen connect to another control plane node and run the iPerf in UDP client mode:
podman run -ti --rm --net host quay.io/kinvolk/iperf3 iperf3 -u -c <node_iperf_server> -t 300The default test will run for 10 seconds, and at the end, the client output will show the average Jitter (from the client perspective). It is recommended to run the test for 5 minutes/300 seconds (-t 300):
# oc debug node/m1
Starting pod/m1-debug ...
To use host binaries, run `chroot /host`
Pod IP: 198.18.111.13
If you don't see a command prompt, try pressing enter.
sh-4.4# chroot /host
sh-4.4# podman run -ti --rm --net host quay.io/kinvolk/iperf3 iperf3 -u -c m0
Connecting to host m0, port 5201
[  5] local 198.18.111.13 port 60878 connected to 198.18.111.12 port 5201
[ ID] Interval           Transfer     Bitrate         Total Datagrams
[  5]   0.00-1.00   sec   129 KBytes  1.05 Mbits/sec  91
[  5]   1.00-2.00   sec   127 KBytes  1.04 Mbits/sec  90
[  5]   2.00-3.00   sec   129 KBytes  1.05 Mbits/sec  91
[  5]   3.00-4.00   sec   129 KBytes  1.05 Mbits/sec  91
[  5]   4.00-5.00   sec   127 KBytes  1.04 Mbits/sec  90
[  5]   5.00-6.00   sec   129 KBytes  1.05 Mbits/sec  91
[  5]   6.00-7.00   sec   127 KBytes  1.04 Mbits/sec  90
[  5]   7.00-8.00   sec   129 KBytes  1.05 Mbits/sec  91
[  5]   8.00-9.00   sec   127 KBytes  1.04 Mbits/sec  90
[  5]   9.00-10.00  sec   129 KBytes  1.05 Mbits/sec  91
- - - - - - - - - - - - - - - - - - - - - - - - -
[ ID] Interval           Transfer     Bitrate         Jitter    Lost/Total Datagrams
[  5]   0.00-10.00  sec  1.25 MBytes  1.05 Mbits/sec  0.000 ms  0/906 (0%)  sender
[  5]   0.00-10.04  sec  1.25 MBytes  1.05 Mbits/sec  1.074 ms  0/906 (0%)  receiver
iperf Done.
sh-4.4#
Recap
In this article, you learned about the new feature in Red Hat OpenShift Container Platform 4.17, an option that allows a cluster to utilize four or five control nodes to enhance control plane resilience. You also learned how to monitor the causes of etcd issues: slow storage/disk latency, CPU overload, etcd database size growth, and network latency between nodes. Network jitter between nodes is another issue explored and demonstrated how to measure network jitter among all control plane nodes using the iPerf3 tool in UDP mode. Learn more about the new OpenShift Container Platform 4.17 non-standard control plane high-availability option enabled by new etcd capabilities and API server optimizations.
